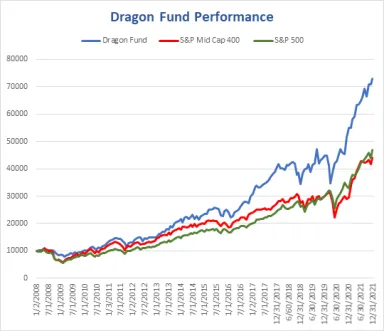
Growth of $100 Investment Since Inception

Annual Returns
| Year | Dragon Fund | S&P 400 | S&P 500 |
|---|---|---|---|
| 2008 | -13% | -36% | -37% |
| 2009 | 16% | 37% | 26% |
| 2010 | 31% | 27% | 15% |
| 2011 | -2% | -2% | 2% |
| 2012 | 15% | 18% | 16% |
| 2013 | 43% | 34% | 32% |
| 2014 | 9% | 10% | 14% |
| 2015 | 2% | -2% | 1% |
| 2016 | 20% | 21% | 12% |
| 2017 | 21.64% | 16.24% | 21.83% |
| 2018 | -13.74% | -11.08% | -4.38% |
| 2019 | 31.10% | 26.20% | 31.49% |
| 2020 | 20.21% | 13.66% | 18.40% |
| 2021 | 32.75% | 24.76% | 28.71% |
2021 Top Ten Holdings by Weight
| Symbol | Name | Weight |
|---|---|---|
| NVDA | NVIDIA Corporation | 6.64% |
| MDB | MongoDB | 4.01% |
| BX | Blackstone Group Inc. Class A | 3.74% |
| LRCX | Lam Research Corporation | 3.56% |
| WAL | Western Alliance | 2.99% |
| AJG | Arthur J. Gallagher & Co. | 2.89% |
| IJH | ishares S&P 400 Core ETF | 2.80% |
| LULU | Lululemon Athletica Inc. | 2.54% |
| AKAM | Akamai Technologies, Inc. | 2.36% |
| PWR | Quanta Services | 2.19% |
| Total | 29.97% |
Information included on this page is not intended to be investment advice and should not be relied upon by any person in making investment decisions. Listings or discussions of individual securities or companies should not be understood to be recommendations of such securities or companies. This information is current only as of the date listed, and the Dragon Fund holdings may be materially different at any time thereafter. Drexel University and its affiliates assume no responsibility or liability for any error, inaccuracy, omission or comment contained on this page or for any use that may be made of such information by the reader.